Good Lookin’ Bike Theft
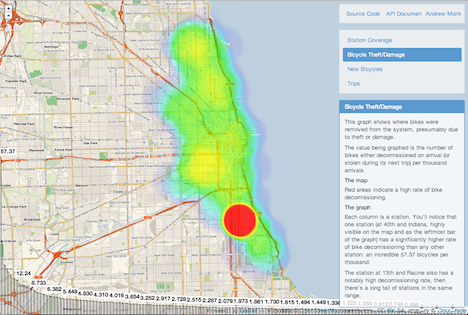
I made these visualizations in 2014 from data released for the Divvy Data Challenge. By exploring and annotating the data, I was able to uncover information about the theft and damage of bicycles in the Divvy bikeshare system.
I started out by throwing the data into Postgres. Then, I fired up Ruby and started exploratorially looping through my tables, adding annotations as I went. I made the final graphs using a combination of heatmap.js and d3.